Oscilloscope Online V2
Difficulty: S+
An updated version of the web-based oscilloscope used to interface with microcontrollers to capture, visualize, and analyze real-time signals remotely.
Community Projects & Developer Tools
Oscilloscope Online V2
🔧 Key Features
-
Enhanced User Interface
A cleaner, more intuitive UI for a seamless user experience. -
Light & Dark Mode Support
Switch between light and dark themes based on your preference or environment. -
Plug and Play
No installation required—simply open the link and start using immediately. -
Offline Access
Fully local functionality—download the repo and host the site locally for use without an internet connection. -
Unlimited Plotting
Visualize as many data streams as you need without restrictions. -
Custom Communication Settings
Define your own baud rate, break characters, and clear screen (CLS) characters for flexible serial communication. -
Real-Time Console Logging
View raw serial data logs alongside plotted visuals. -
Flexible Plotting Options
Plot data by index or timestamp depending on your use case. -
Multiple Scale Types
Choose between linear, logarithmic (base 2), and logarithmic (base 10) scales. -
Support for Null Values
Handles incomplete or missing data gracefully during plotting. -
Auto CLS Automatically clears screen after the number of collected data has passed a pre-defined threshold.
-
Auto-Scaling Y-Axis
Automatically adjusts the Y-axis range for optimal data visibility. -
Interactive Visualization
Zoom in and explore plots dynamically with a responsive, interactive graphing interface.
Example of Interactivity
📈 Plotting Modes
The plotter supports three distinct modes to fit a variety of use cases, ranging from general-purpose visualization to precision timing:
-
Index Mode
Plots data against its sequence index. This mode creates a consistent and unchanging X-axis where each point represents the order in which the data was received. -
Automatic Time Scaling
Utilizes the system’s internal clock to timestamp data upon arrival and uses those values on the X-axis. Suitable for general time-based plotting, but may not offer precise millisecond accuracy due to background processing delays. -
Manual Time Scaling
Treats the first value in each data packet as the timestamp (typically in milliseconds). Ideal for high-precision plots—especially when using functions likemillis()in Arduino-based applications. This mode offers the most reliable timing accuracy for microcontroller data.
Example of Time Scale feature
📤 Data Format
The plotter expects incoming data to follow this structure:
- Each value should be separated by the configured break character.
- The data line must end with a newline (
\n).
🧹 Clear Screen Command
To clear all previously collected data, simply send:
This will reset the plotter and erase existing data.
⏱ Manual Time Scaling Note
If you’re using Manual Time Scale mode, the first value (Value1) is treated as the timestamp in milliseconds.
This is ideal for use with millis() in Arduino or similar microcontrollers.
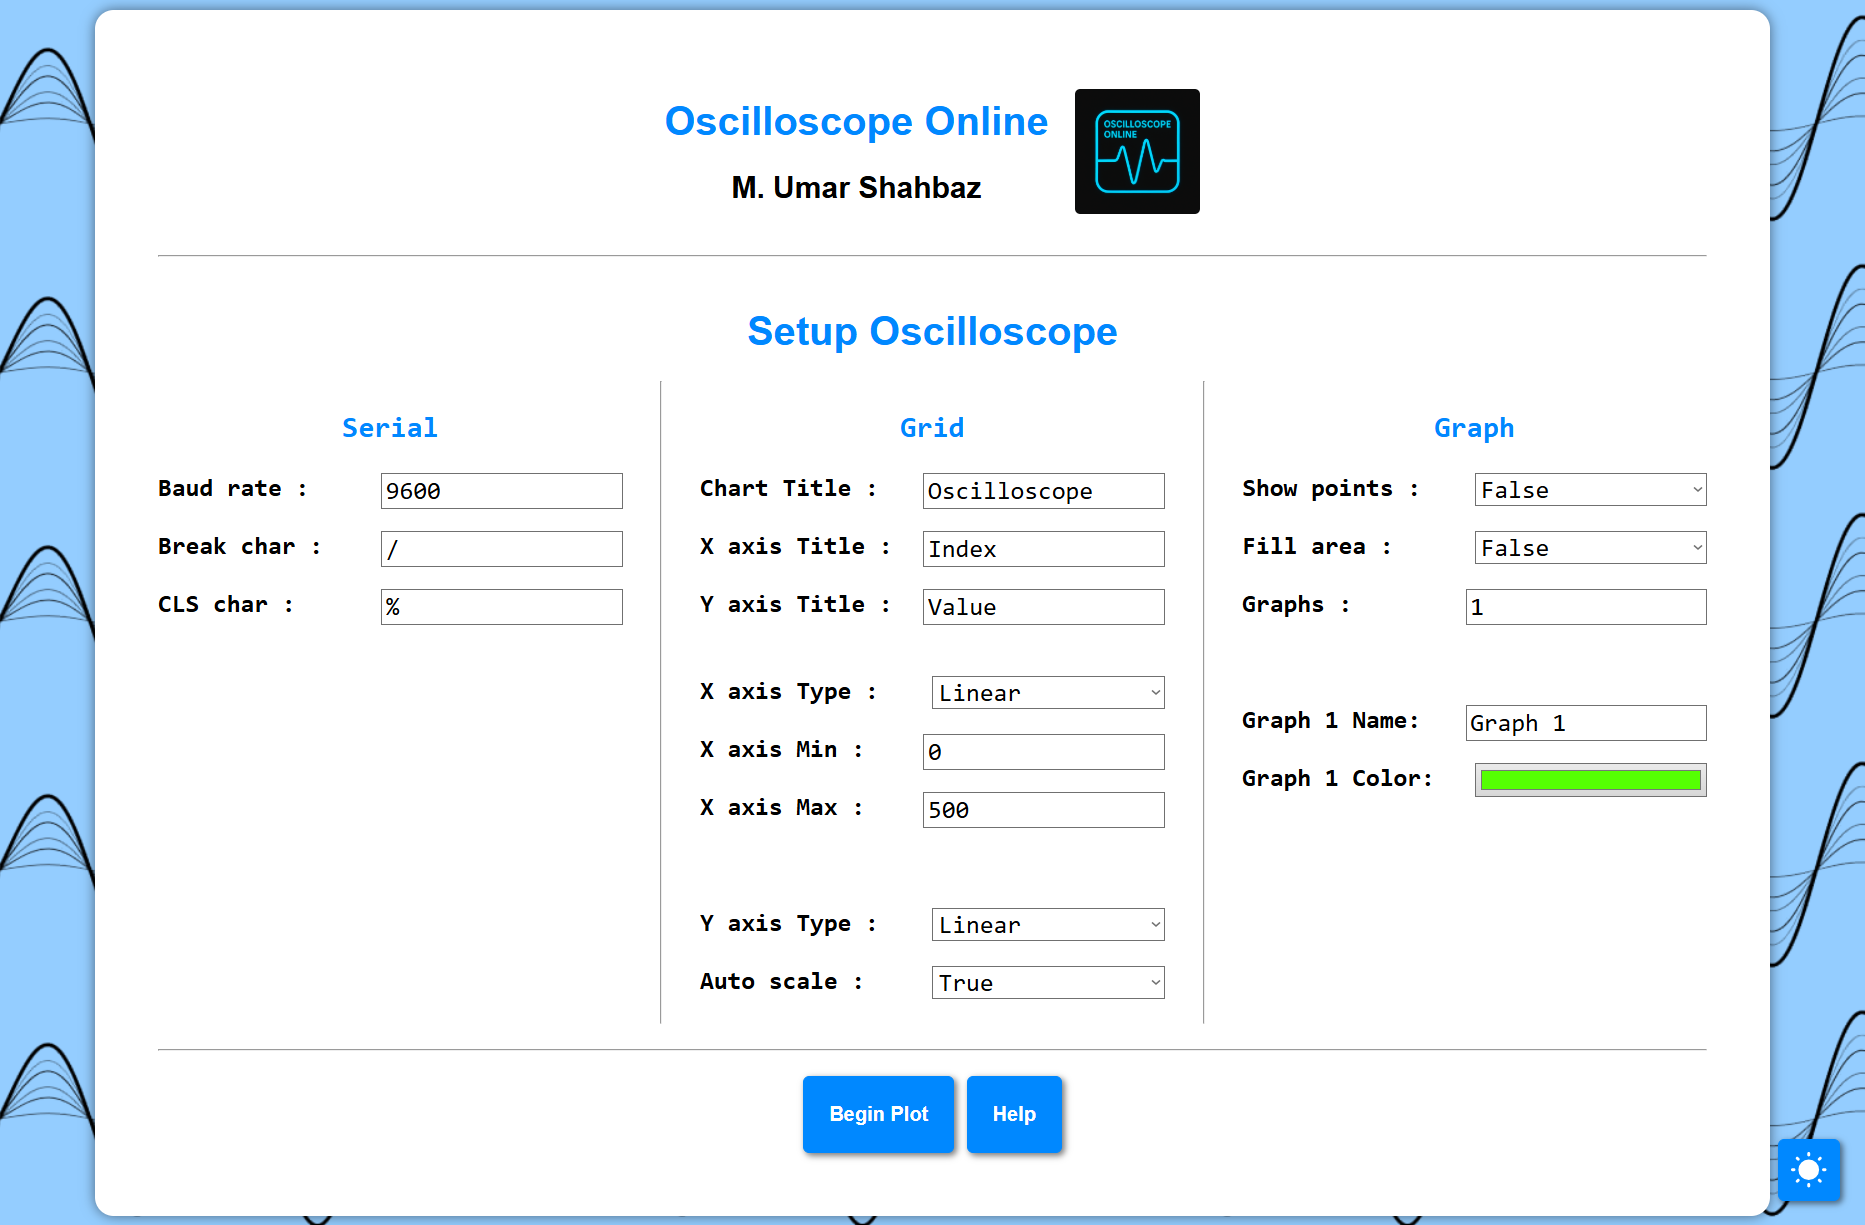
⚙️ Setup Page
All configuration options are available on the Setup page.
You can customize parameters such as baud rate, break/CLS characters, plot types, and more.
A built-in Help section is also provided to explain the purpose and functionality of each setting—perfect for new users or quick reference.
🎨 Themes
The application supports both Light and Dark themes to suit different environments and user preferences.
You can toggle between themes anytime.
Your selected theme is automatically applied across all pages for a consistent visual experience.
🌐 Browser Requirements
To ensure full functionality, your browser must support the following:
-
Web Serial API – Required for direct communication with serial devices.
Supported in Chromium-based browsers like Chrome, Edge, and Opera. -
JavaScript – Core functionality and interactivity rely heavily on JavaScript.
-
HTML5 – Ensures proper rendering of structural elements.
-
CSS3 – Required for styling, responsive layout, and theming (Light/Dark Mode).
Made with uPlot

